IBM — Operations Analytics
A tool for IT operations professionals.
Roles
- Design Team Lead
- UX Design
- Page Copy
- Information Architecture
IBM Operations Analytics
Identifying issues before they become catastrophes.
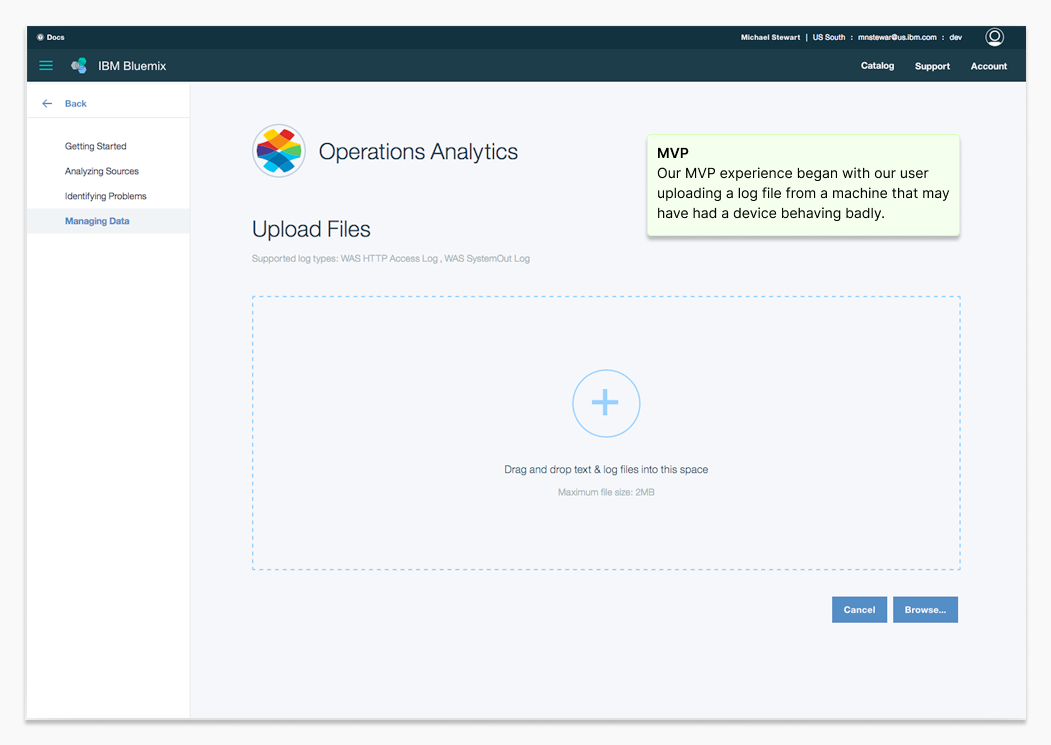
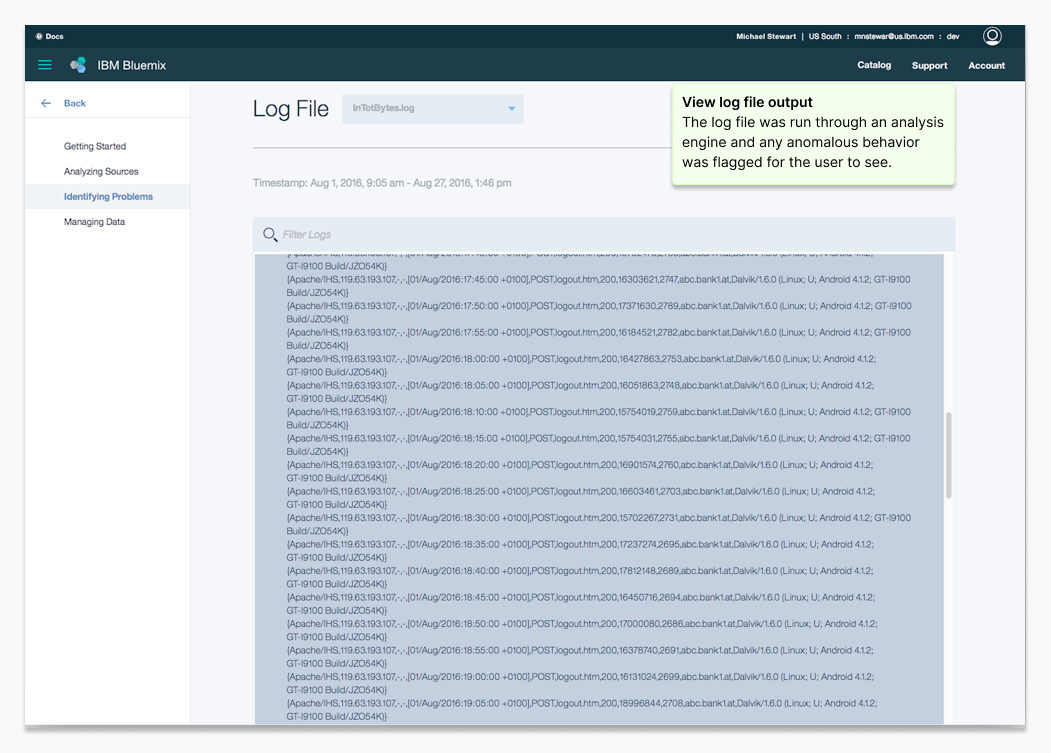
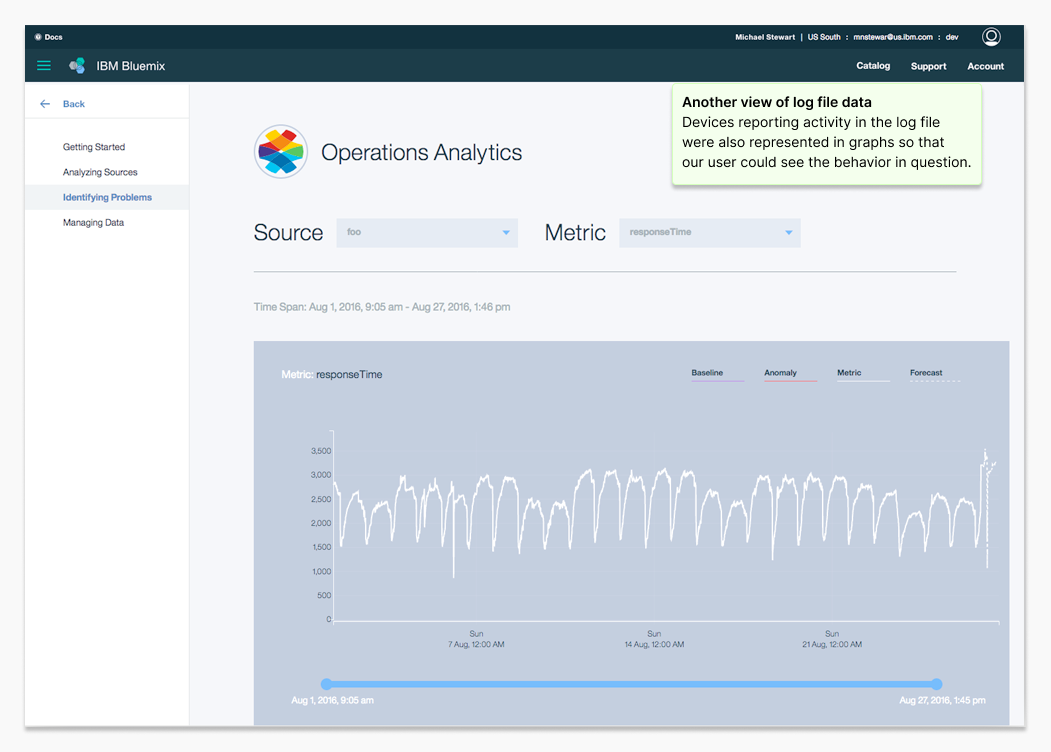
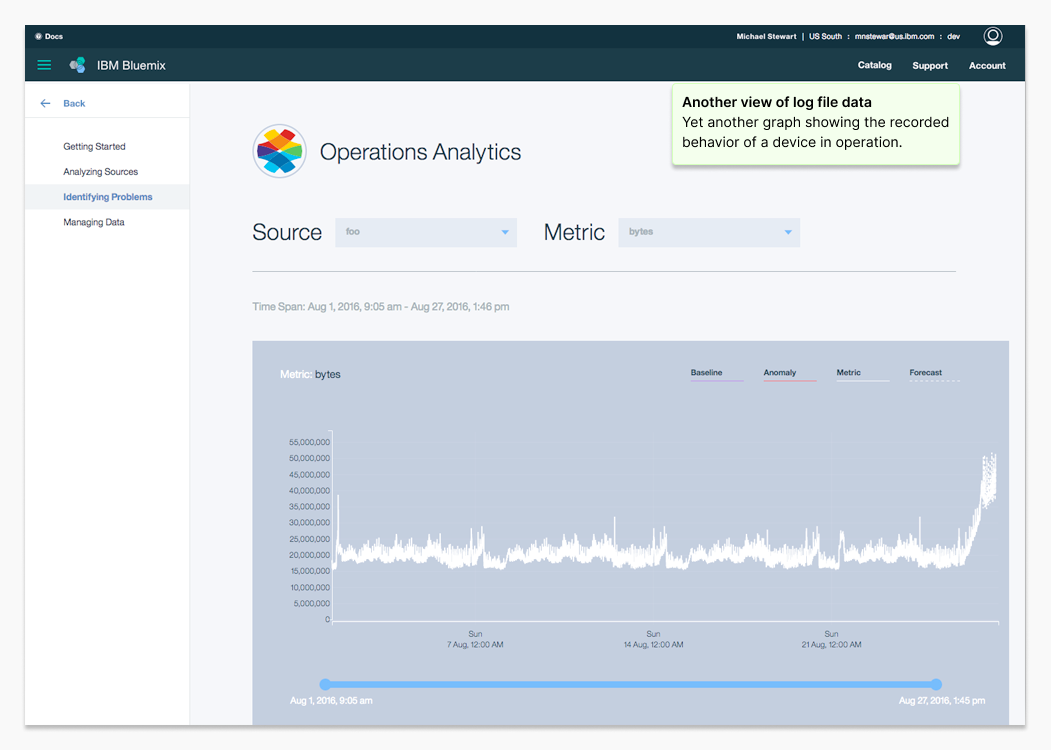
Operations Analytics helped system administrators detect abnormal behavior in data center logs early enough to prevent outages. Users uploaded log files and used the tool to spot patterns that pointed to failing hardware or performance bottlenecks.
Our primary user was Jim, a system administrator tasked with maintaining seamless operations across the infrastructure.
As Design Lead, I focused on team execution and decision-making, keeping design aligned with sprint delivery and user validation:
- Backlog Management: Partnering with the Offering Manager and Development team to refine and prioritize user stories.
- Sprint Planning and Delivery: Ensuring designs were assigned to the team, completed within the two-week sprint cycle, and delivered on schedule.
- User Validation: Working closely with our user researcher to validate designs with real users and incorporating their feedback into iterative improvements.
An MVP of the product was successfully launched on the IBM Bluemix cloud catalog, providing IT professionals like Jim the tools to safeguard their systems and prevent potential failures

After conducting user interviews, we built empathy maps from which we extracted user insights.
“It's the little issues that go un-detected that really come back to bite you.”
— Interview subject
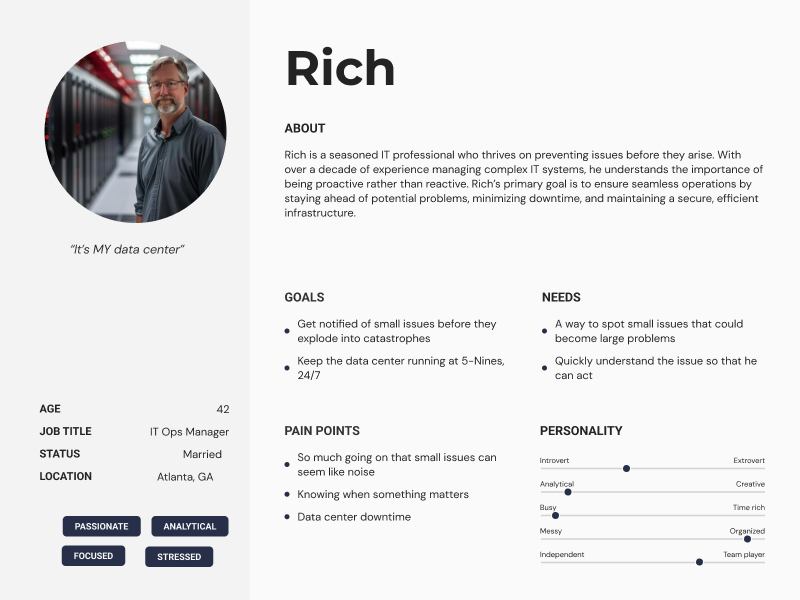
Once we had clear insights and a good understanding of our target user, we created a simple proto-persona.
“I've got so much going on, if you can help even a little in staying ahead, that would be huge.”
— Interview subject
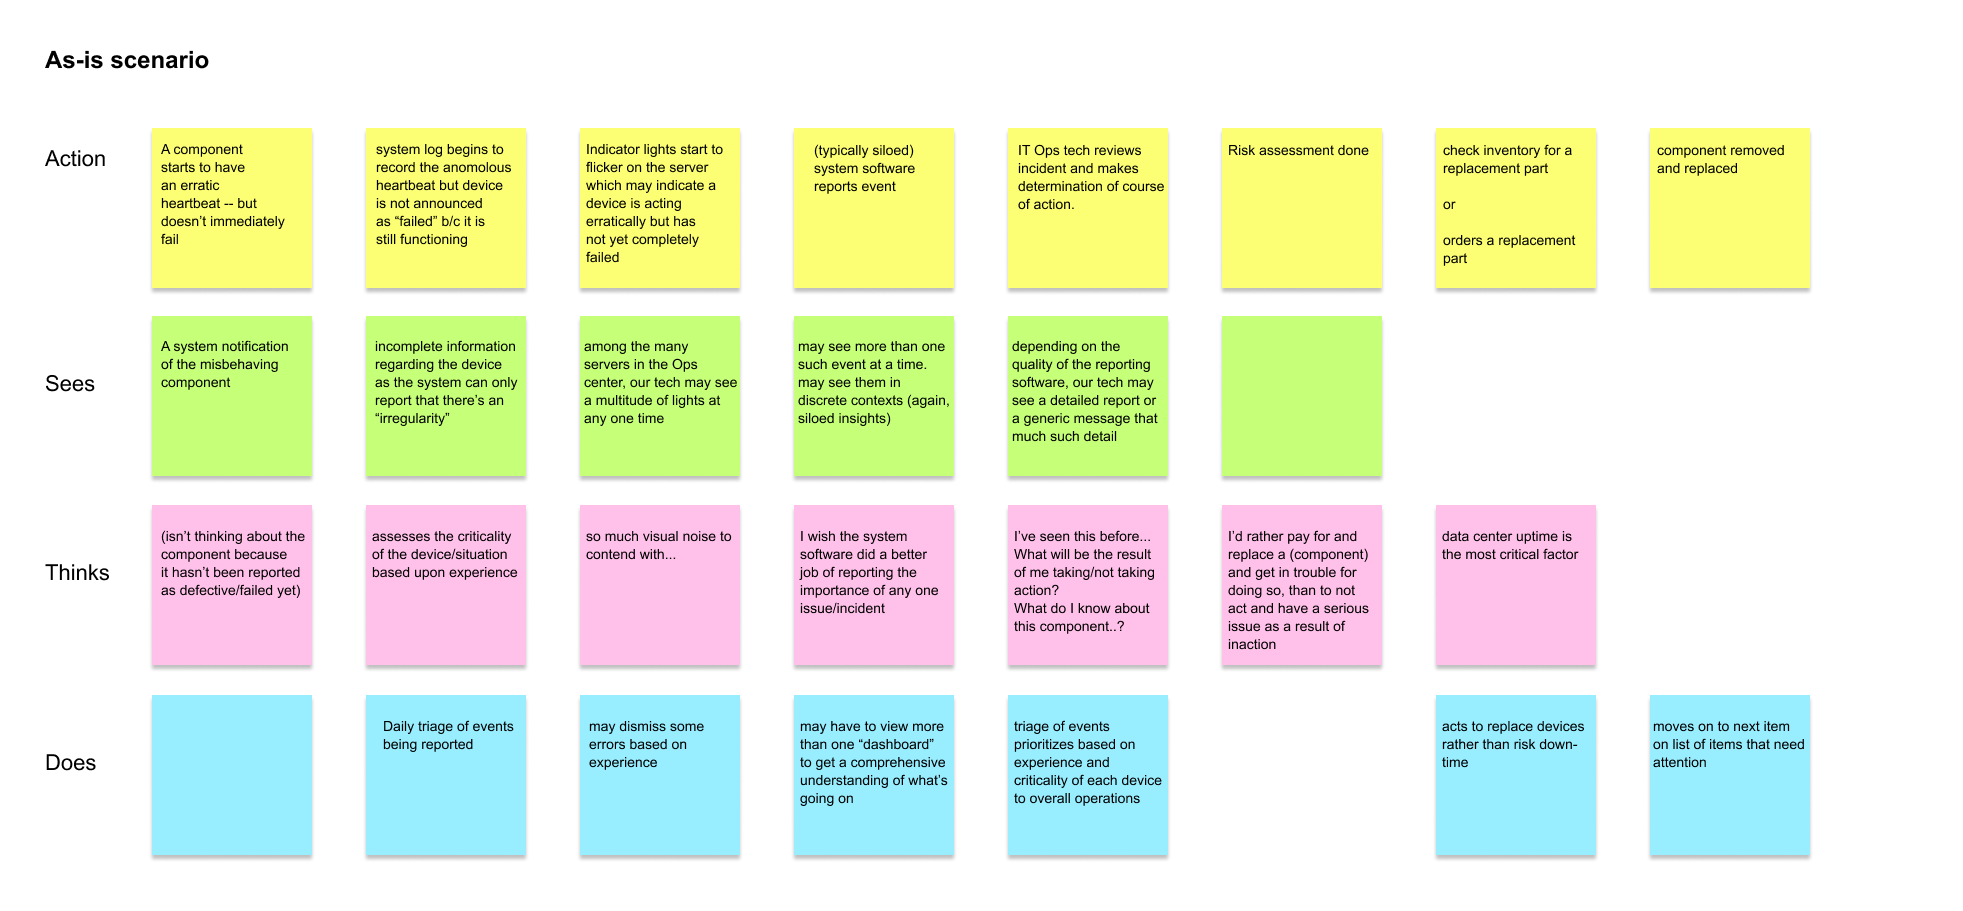
This is an initial as-is flow diagram done for Operations Analytics. We began by looking at a typical data center tech's course of action during their workday.
“Keeping the data center running is Job One.”
— Interview subject
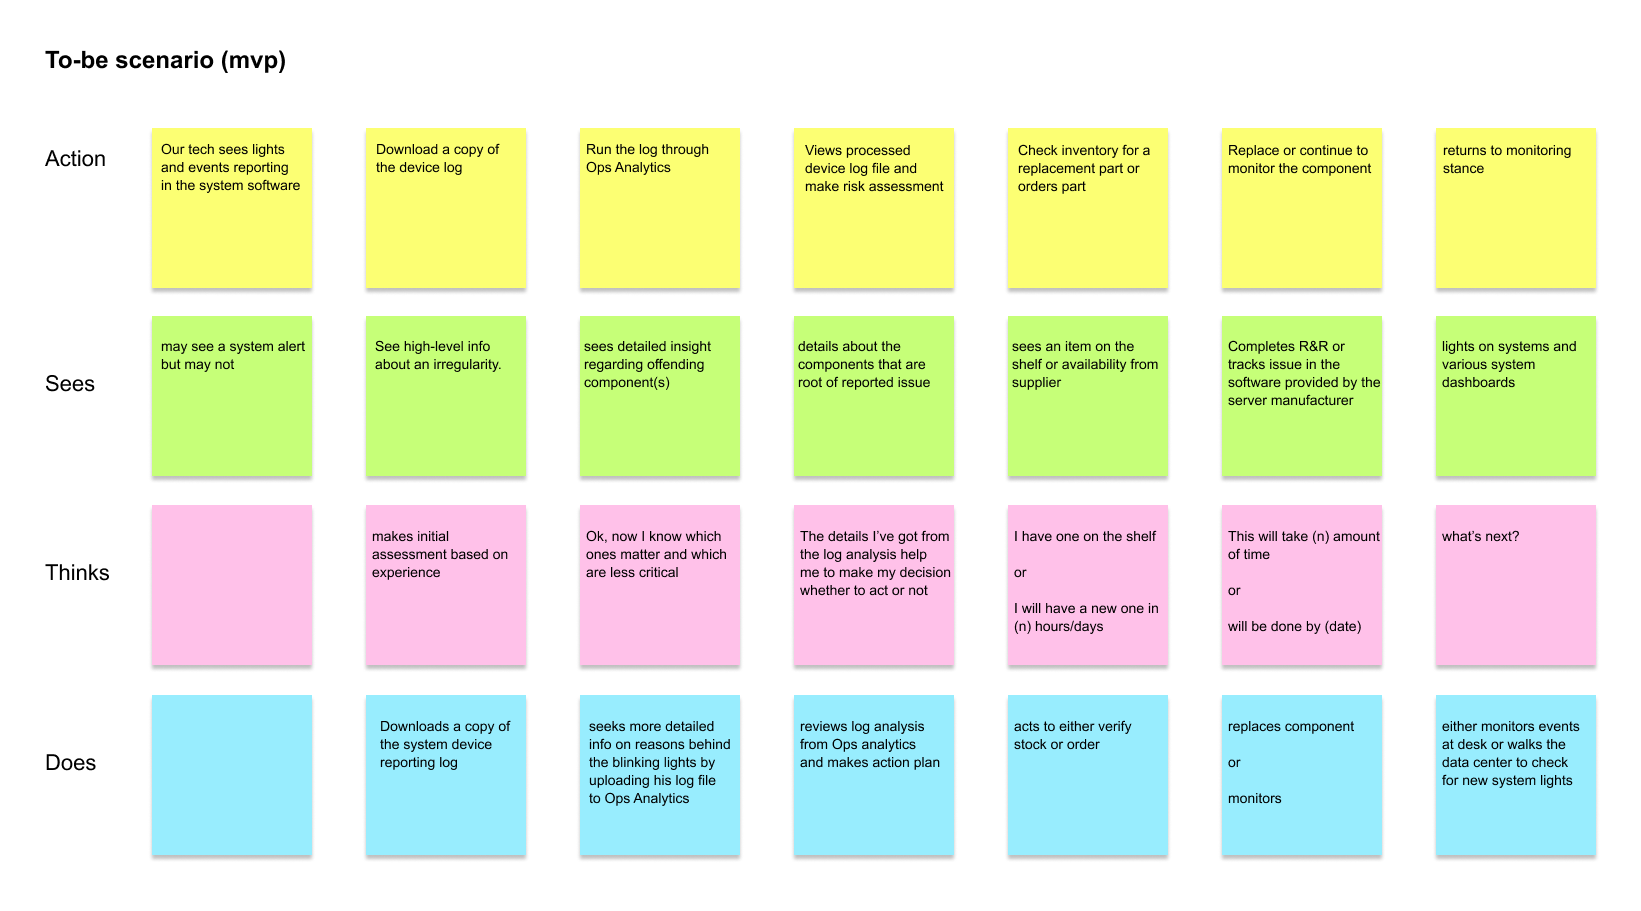
We did a to-be flow for our offering MVP. We knew that the MVP would be less than ideal but would get the tech working in a slightly different way.
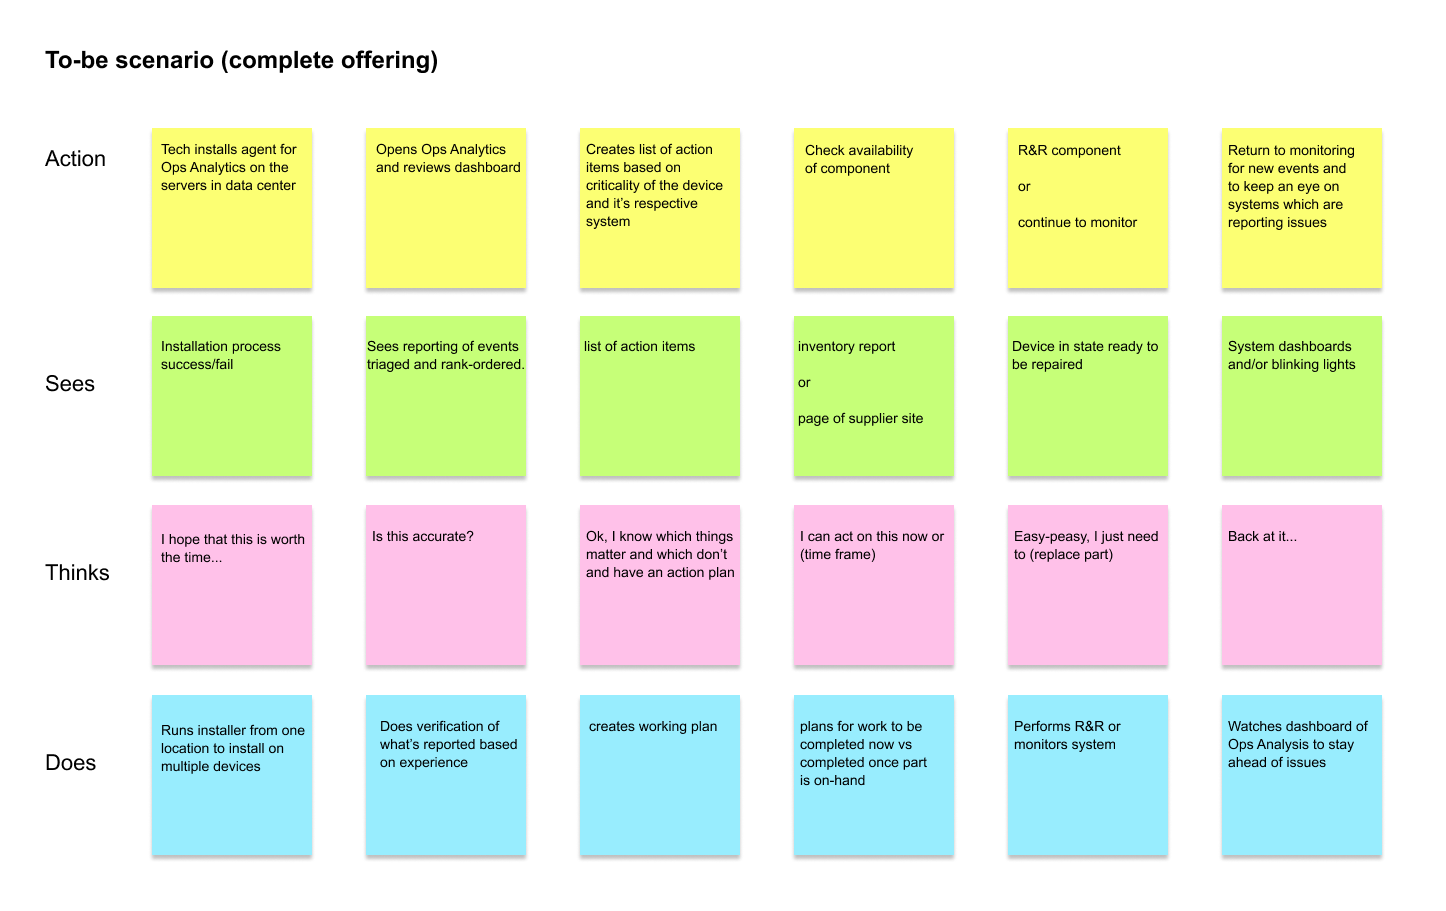
We also did a to-be flow for our offering in its mature or complete state. We were confident that this offering would change the way such data center techs did their work.
Get in touch
I'd love the opportunity to discuss how my skills and experience can align with and support your organization's goals.